How to Use Tape Diagram for Problem Solving
September 19, 2023

Imagine having a simple yet powerful tool at your fingertips to unravel math mysteries! That's where tape diagrams step into the spotlight.
Think of them as your math buddy – a visual representation resembling a snippet of tape that opens up a world of number connections. Whether you’ve heard them referred to as strip diagrams, bar models, fraction strips, or length models, they all point to the same idea. With tape diagrams, you’re not just solving math problems; you’re crafting a visual journey that untangles the knots of mathematical concepts. These diagrams are like keys to unlock the doors of word problems, helping you quickly organize information and share your brilliant mathematical insights.
What are Tape Diagrams?
Imagine a visual aid that effortlessly guides you through mathematical puzzles – that’s the magic of tape diagrams. These rectangular wonders, resembling strips of tape, are here to simplify your computations. Tape diagrams are your trusty sidekick if you grapple with word problems built on ratios.
Every student’s toolkit should include the skill of creating and using tape diagrams. Why? Because these diagrams hold the key to understanding mathematical concepts and depicting relationships within problems. With tape diagrams, you’re solving problems and bringing mathematical ideas to life. They become your artistic canvas, allowing you to showcase your problem-solving strategies and share your mathematical thoughts.
Mastering Tape Diagrams
Tape diagrams might sound complex, but fear not! Let’s walk through the steps to craft these problem-solving marvels. Think of tape diagrams as your creative toolkit – they slice daunting tasks into bite-sized graphical goodness. Whether wrestling with tricky word problems or tackling equations head-on, tape diagrams are your reliable companion, making math a visual adventure. So, let’s dive into the artistic journey of creating tape diagrams, one step at a time.
Step 1: Analyze the Problem
Take a moment to read and dissect the problem statement or equation. This initial step is like getting to know the characters before writing a story – it’s essential! By absorbing the problem’s essence, you’ll grasp the scenario and envision pathways to crack it wide open.
Step 2: Gather Your Tools
Now that you’re on a first-name basis with the problem, it’s time to dissect it further. Think of it as breaking down a complex puzzle into its elemental pieces. What parts of the problem are like the corner pieces of a jigsaw puzzle, crucial for completing the whole picture? Identify these components, the building blocks that will populate your tape diagram.
Step 3: It’s Time to Draw the Tape Diagram
With your mental toolkit assembled, it’s time to create your masterpiece – the tape diagram. Envision a long, rectangular canvas resembling a piece of tape. Divide this canvas into smaller sections using neat little boxes. These sections will represent the components you identified in Step 2. Depending on the complexity of the problem, your diagram might have just a couple of sections or a handful. There’s no hard and fast rule, but aim for at least two sections to give your diagram a solid foundation.
Step 4: Solution
Your tape diagram is like a map guiding you to the treasure of the solution. It’s time to put your diagram to work. Solve the problem using the insights your diagram provides. Label the sections, incorporate your gathered information, and let the magic happen.
Putting It into Practice
Now, let’s bring all this theory to life with an example. Imagine a problem where you need to divide your allowance among different expenses. This is where your tape diagram steps in, carving out sections for each expense and revealing the mathematical treasure of how much to allocate where.
Tape diagrams might be simple in concept, but they’re versatile and mighty in practice. They’re not just sketches on paper but your companions on your mathematical journey, making complex problems a visual delight. So, the next time math gives you a puzzling stare, remember that tape diagrams are your secret weapon – transforming numbers into captivating stories of logic and creativity.
Example: Create a tape diagram that represents these equations.
( i ) \(4 + 8 = 12\)
( ii ) \(9 + 6 = 15\)
Solution
( i ) Crafting a tape diagram for \(4 + 8 = 12\) involves making four equal cells and adding eight more.
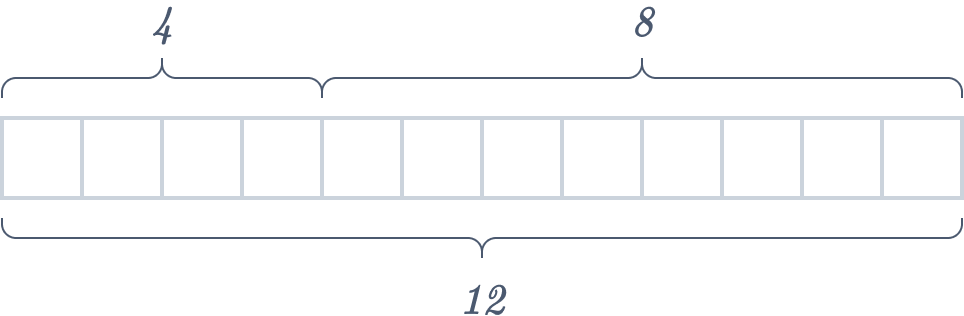
Another option for visual representation could be a complete rectangle divided into two segments, depicted below. It’s worth noting that the rectangle representing \(8\) is longer than the one corresponding to \(4\).

( ii ) Constructing a tape diagram to visualize \(9 + 6 = 15\) involves crafting nine identical cells and adding six more.

Another way to depict this would be a complete rectangle divided into two sections, as presented below. It’s important to observe that the rectangle representing \(9\) is longer than the one representing \(6\).

Tape Diagram for Multiplication and Division
Tape diagrams can also serve as a visual aid for word problems involving multiplication and division.
Examples: Draw a tape diagram that represents these equations.
( i ) \(3 × 9 = 27\)
( ii ) \(2 × 4 = 8\)
Solution
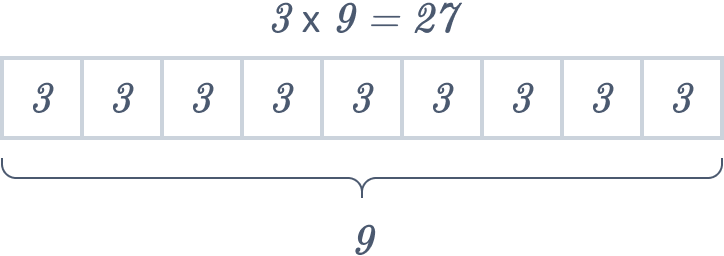
( i ) In the case of \(3 × 9 = 27\), \(3\) and \(9\) are called factors. To illustrate this with a tape diagram, let’s create nine equal cells, with three inscribed within each cell as a demonstration.
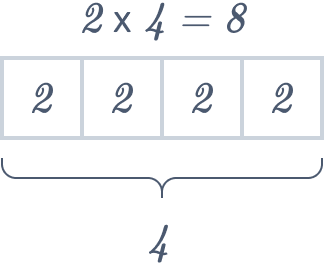
( ii ) To represent \(2 × 4 = 8\), sketch four identical cells and jot down the number \(2\) within each cell. This serves as an illustrative tape diagram for multiplication.
Conclusion
In essence, the tape diagram stands as an efficient tool for cracking mathematical puzzles. Compared to rote memorization, which can fall flat if grounded in understanding, the beauty of the tape diagram lies in its adaptability. It empowers students not only to master the “how” but also the “why” – fostering a genuine grasp of concepts. By embracing these visual aids, students embark on improved comprehension. As they unravel problems with the guidance of tape diagrams, they enhance their problem-solving prowess and nurture a deeper connection with the world of mathematics.
FAQs
What are alternate terms for tape diagrams?
Tape diagrams often go by other names, such as strip diagrams, bar models, length models, or fraction strips. These terms are commonly used interchangeably to refer to this visual representation tool.
Why is it called a tape diagram?
A tape diagram earns its name from its resemblance to a strip of tape. This visual tool aids in tackling a variety of calculations, including ratios, addition, subtraction, and, most notably, multiplication. Its simplicity and effectiveness make it a versatile asset in mathematics.
What advantages do tape diagrams offer?
Tape diagrams shine by preventing students from memorizing concepts they may need help understanding. They encouraged a deeper understanding of mathematical ideas and proved to be particularly effective in successfully solving word problems in mathematics.
Can't find your query?
Fill out the form below with your query and we will get back to you in 24 hours.